Don’t miss out!
Get the latest resources sent directly to your inbox.
Data is a very broad term that encompasses every part of your dealership.
Merriam-Webster defines data as:
“Facts or information used usually to calculate, analyze, or plan something.” Meanwhile, “data mining” is defined as, “the practice of searching through large amounts of computerized data to find useful patterns or trends.”
If you’re using a dealership management system, you will have a ton of data readily available at your dealership. our data is like gold—you can mine it often.
Watch this video for a crash course in understanding your dealership’s data and how you can use it to move the needle, featuring Jason Krantz, CEO and Founder of Strategy Titan, and Don Miller, Senior Data Consultant at Constellation Dealer Group:
You may have heard the phrase, you can’t monitor what you don’t measure and don’t expect what you can’t inspect.
If you can’t inspect it, you can’t track it. If you can’t track it, there is no accountability.
No accountability also means there is no motivation. And no motivation means no reason to change.
Knowing where you’ve been and where you are will help you determine where you’re going. Dealership data allows you to establish baselines, benchmarks, and goals to keep you moving forward. It also lets you track an employee’s performance, a department’s performance, and your dealership’s performance as a whole.
Meanwhile, trend analysis can improve your business by helping you identify areas that are doing well, areas that aren’t, and provide valuable evidence to help make better-informed decisions.
There are several key dealership performance data that every dealership should be tracking. They generally fall into two buckets: internal data and external data.
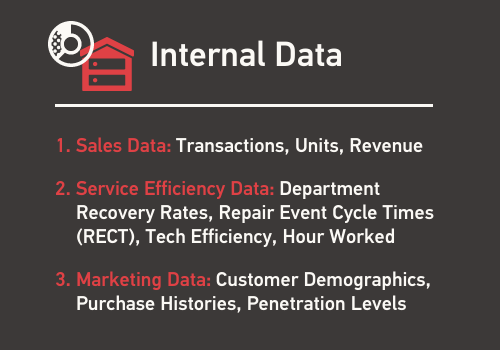
Internal data includes any data pertaining to your dealership’s internal operation. This data helps you run your dealership and optimize your operation, including:
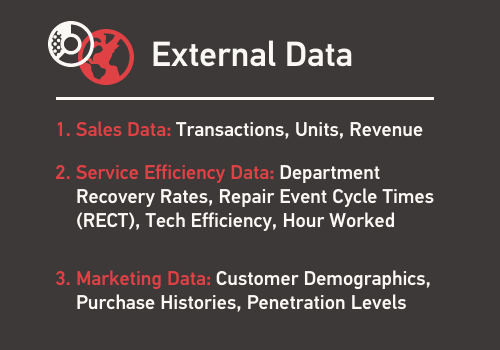
External data is any data that has been captured, processed, or provided from outside of your dealership. This data helps you better understand your customer base and the competitive landscape.
There are four key types of external data you can track at your dealership:
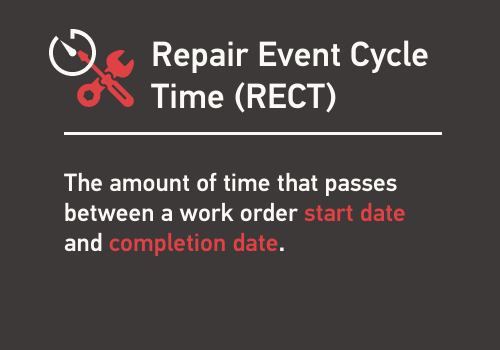
RECT reporting falls under both internal and external data. Repair Event Cycle Time (RECT) is the amount of time that passes between a work order start date and completion date. Basically, it’s the amount of time it takes to repair a unit at your shop.
Between your start and completion dates, you have several other key dates – your first and last labor dates and your “parts ordered” and “parts received” dates.
Tracking your dealership’s RECT will help you identify bottlenecks that slow down your service. Meanwhile, benchmarking your dealership’s RECT against other dealerships in your region will give you insights into how your dealership’s customer experience compares to your competition.
IDS offers monthly regional RECT reports that you can use to benchmark your dealership’s performance against other dealers in your region. Get your RECT report here.
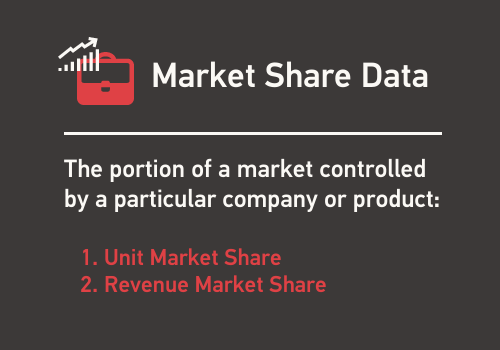
Market Share is one of the most important types of external data you can track and one of the key dealership management metrics you should be using.
To define Market Share, it’s the portion of a market controlled by a particular company or product. Within the context of the RV industry, there are two main ways you can break down market share:
Generally, we recommend focusing on Revenue Market Share. The reason for this is because, as we all know, a travel trailer unit is a little bit different than a high-end Class-A unit.
The beauty of Market Share is that it’s impartial – it impacts all companies equally. Market Share helps you conduct a fundamental analysis to understand the various things that are driving not only your business but also your market.
It’s also a great way to identify how your dealership is performing in the market. By tracking Market Share, you can contextualize your dealership’s growth within the wider market. For example, if your business is up 10% and the rest of the market is up 10%, that means you’ve risen with everybody else.
This metric tells you exactly how you are riding that wave, or if you’re growing faster or slower.
Market Share also clearly highlights trends in external factors like customer buying habits. For example, in an IDS 2022 RV industry statistics survey, 77% of RV dealers surveyed said online sales and marketing will be a priority for their business in 2022.
Interested in diving deeper into RV industry trends? Read our RV Industry Trends Report.
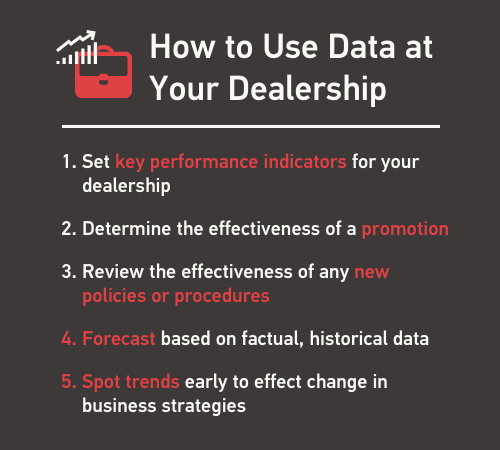
There are a variety of ways you can use data at your dealership to improve processes, drive more revenue, and meet changes in the market. Here are some ways you can use data to measure and impact revenue at your dealership.
Without concrete data to base your decision-making on, you’re taking shots in the dark. By leveraging your dealer management solution to track and report on the right dealership data, you can make intentional improvements to your business that drive real growth.
Get the latest resources sent directly to your inbox.