Don’t miss out!
Get the latest resources sent directly to your inbox.

When’s the last time you evaluated the amount of time it takes to service a unit at your dealership?
If you’re not tracking how long it takes, you may be missing out on opportunities to increase your dealership’s revenue, productivity, and – most importantly – customer satisfaction. After all, the last thing a customer wants to hear when they bring their unit in for servicing is that it could take weeks to repair. It’s probably the last thing you want to tell a customer too.
That’s why IDS developed monthly Repair Event Cycle Time (RECT) reports to help you spot your dealership’s shortcomings and improve its service. With the insights and expertise of Don Miller, Senior Data Consultant at Constellation Dealer Group, we go into more detail about what RECT is, how to identify your most common service bottlenecks, and how to use the report to reduce your RECT.
Watch this video to learn more:
What Affects Your Dealership’s RECT? (Most Common Bottlenecks)
Why Should You Compare Your RECT to Regional and National Averages?
Repair Event Cycle Time is the number of days from the start of a Work Order until the completion of that Work Order. Put simply, it is the amount of time it takes for a unit to be repaired at your shop. IDS RECT reports are released every month for RV and marine dealers with data comparing regional and national RECT averages. The regional and national metrics give your dealership insight into where you want to focus your efforts to improve your RECT, such as historical data, the average RECT by Service Advisors, the RECT time of top brands, and more.
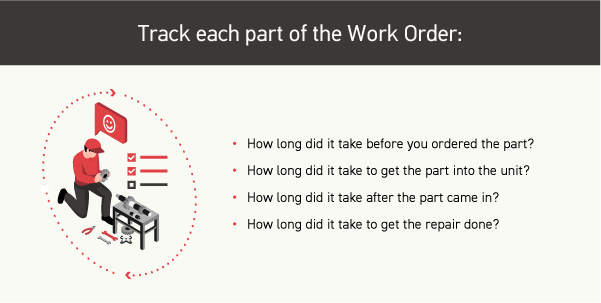
If you’re not monitoring what’s going on either within the internal metrics at your dealership or looking at the RECT reports, then you can’t manage it. It’s important to pay attention to every metric that you can at your dealership. Don’t just see how long it takes overall for the Work Order to be complete.
Breaking down each individual aspect of the entire Work Order lets you look at each section to really nail done and determine where improvements can be made. Some dealerships are even setting up triage teams to prioritize Work Orders and figure out what needs to be expedited and what doesn’t. For example, if it’s a warranty part, then the part can be ordered even if it can’t get to the technician for another 2-3 weeks. By diagnosing more quickly what needs to be done first, units are serviced quicker too.
Read Next: How Crestview RV Uses Actionable Data to Repair RVs Faster
There are two common bottlenecks that impact RECT the most: warranty coverage and out of stock parts. However, there are also other emerging trends in today’s market that will have long-term effects on RECT.
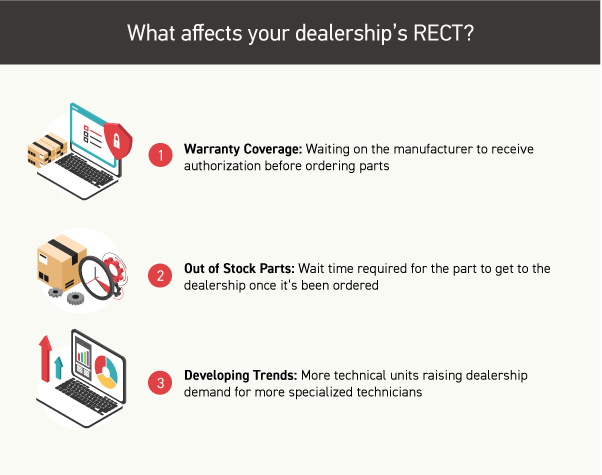
With warranty coverage, it’s a matter of getting the authorization and completing the paper to ensure that the authorizations are good for the dealer to get paid for it. However, most of the time, dealers are waiting on manufacturers to give them the authorization before they can even proceed with ordering the required part.
Out of stock parts also decrease RECT because of the wait time required for the part to get to the dealership once it’s been ordered. Coupled with recent supply chain issues, dealers are putting the extra parts that they do have into units to get them out on the lot to sell. This means that there might not be extra parts leftover for repair work. For example, there are so many RV models, makes, and floorplans that if you have a unit that’s more than a few years old, the manufacturer might not even be making that part anymore, which means dealers will need to look elsewhere for the part.
In today’s market, another noticeable trend that we’re hearing from dealers is that they’re dealing with a shortage of qualified technicians. RVs and boats are becoming more technical and complex than they’ve ever been. Manufacturers are coming out with tons of new models, but they’re also pumping out units faster than they should be.
Quality control issues mean that even newer units are coming back to the shop for repair shortly after a customer has purchased it. The increased demand for RVs and watercrafts over the past few years has increased dealerships’ revenues. However, it means technicians are now working longer hours leading to higher employee burnout and employee turnover rates.
Read Next: Dealership Inventory Management Best Practices
Dealerships ought to compare their RECT results with the region’s averages to determine if they are performing above or below dealerships in similar circumstances, climates, markets. Additionally, by comparing your region’s results with the national average, it helps you see how your region is trending.
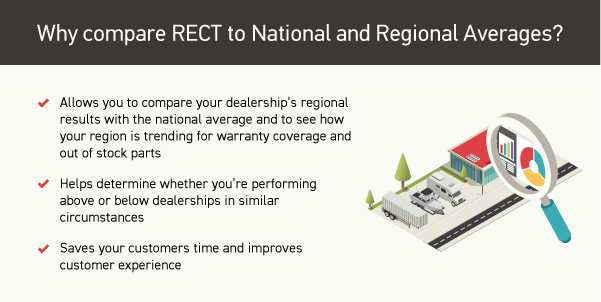
This is particularly helpful for reviewing the impacts of the two previously mentioned bottlenecks – warranty coverage and out-of-stock parts. For example, is your region’s out of stock parts greater or lower than the national average? How does your dealership compare to its region as a whole? Then, you can determine how out of stock parts are trending in your region compared to the nation.
The regional RECT averages help dealers compare themselves to others in the region. The national RECT averages are to see how the region is doing. To be competitive, your dealership should always strive to be below your region’s average, even just by a day. That way, you know that your dealership is matching or doing better than other dealers in the same market. This will enable your dealership to increase its profitability.
Saving your customers time can also add up to an immense amount of money. For example, by saving your customers a week of RECT, your technicians have seven days to work on other tickets. Take a look at your technicians’ hourly rates. Then, multiply that out to see how much time and money you can save your dealership. Keeping track of RECT will also allow your service writers to set reasonable expectations for customers on costs, time estimates, and warranties.
Read Next: 6 Important Skills Service Writers Need to be Successful
If your dealership’s RECT averages are lower than others, it’s not your technicians’ fault. But rather, begin to track the appropriate metrics at your dealership to determine where the bottlenecks may be occurring. Those metrics can give you insight into how you can make changes at your dealership to improve your RECT.
The best time that you can start implementing changes that will improve your RECT is now. Start building and tracking your dealership’s internal numbers to determine where you can focus your improvements.
For the latest RECT report and F&I sales data, check out our Dealership Insights Report.

Get the latest resources sent directly to your inbox.